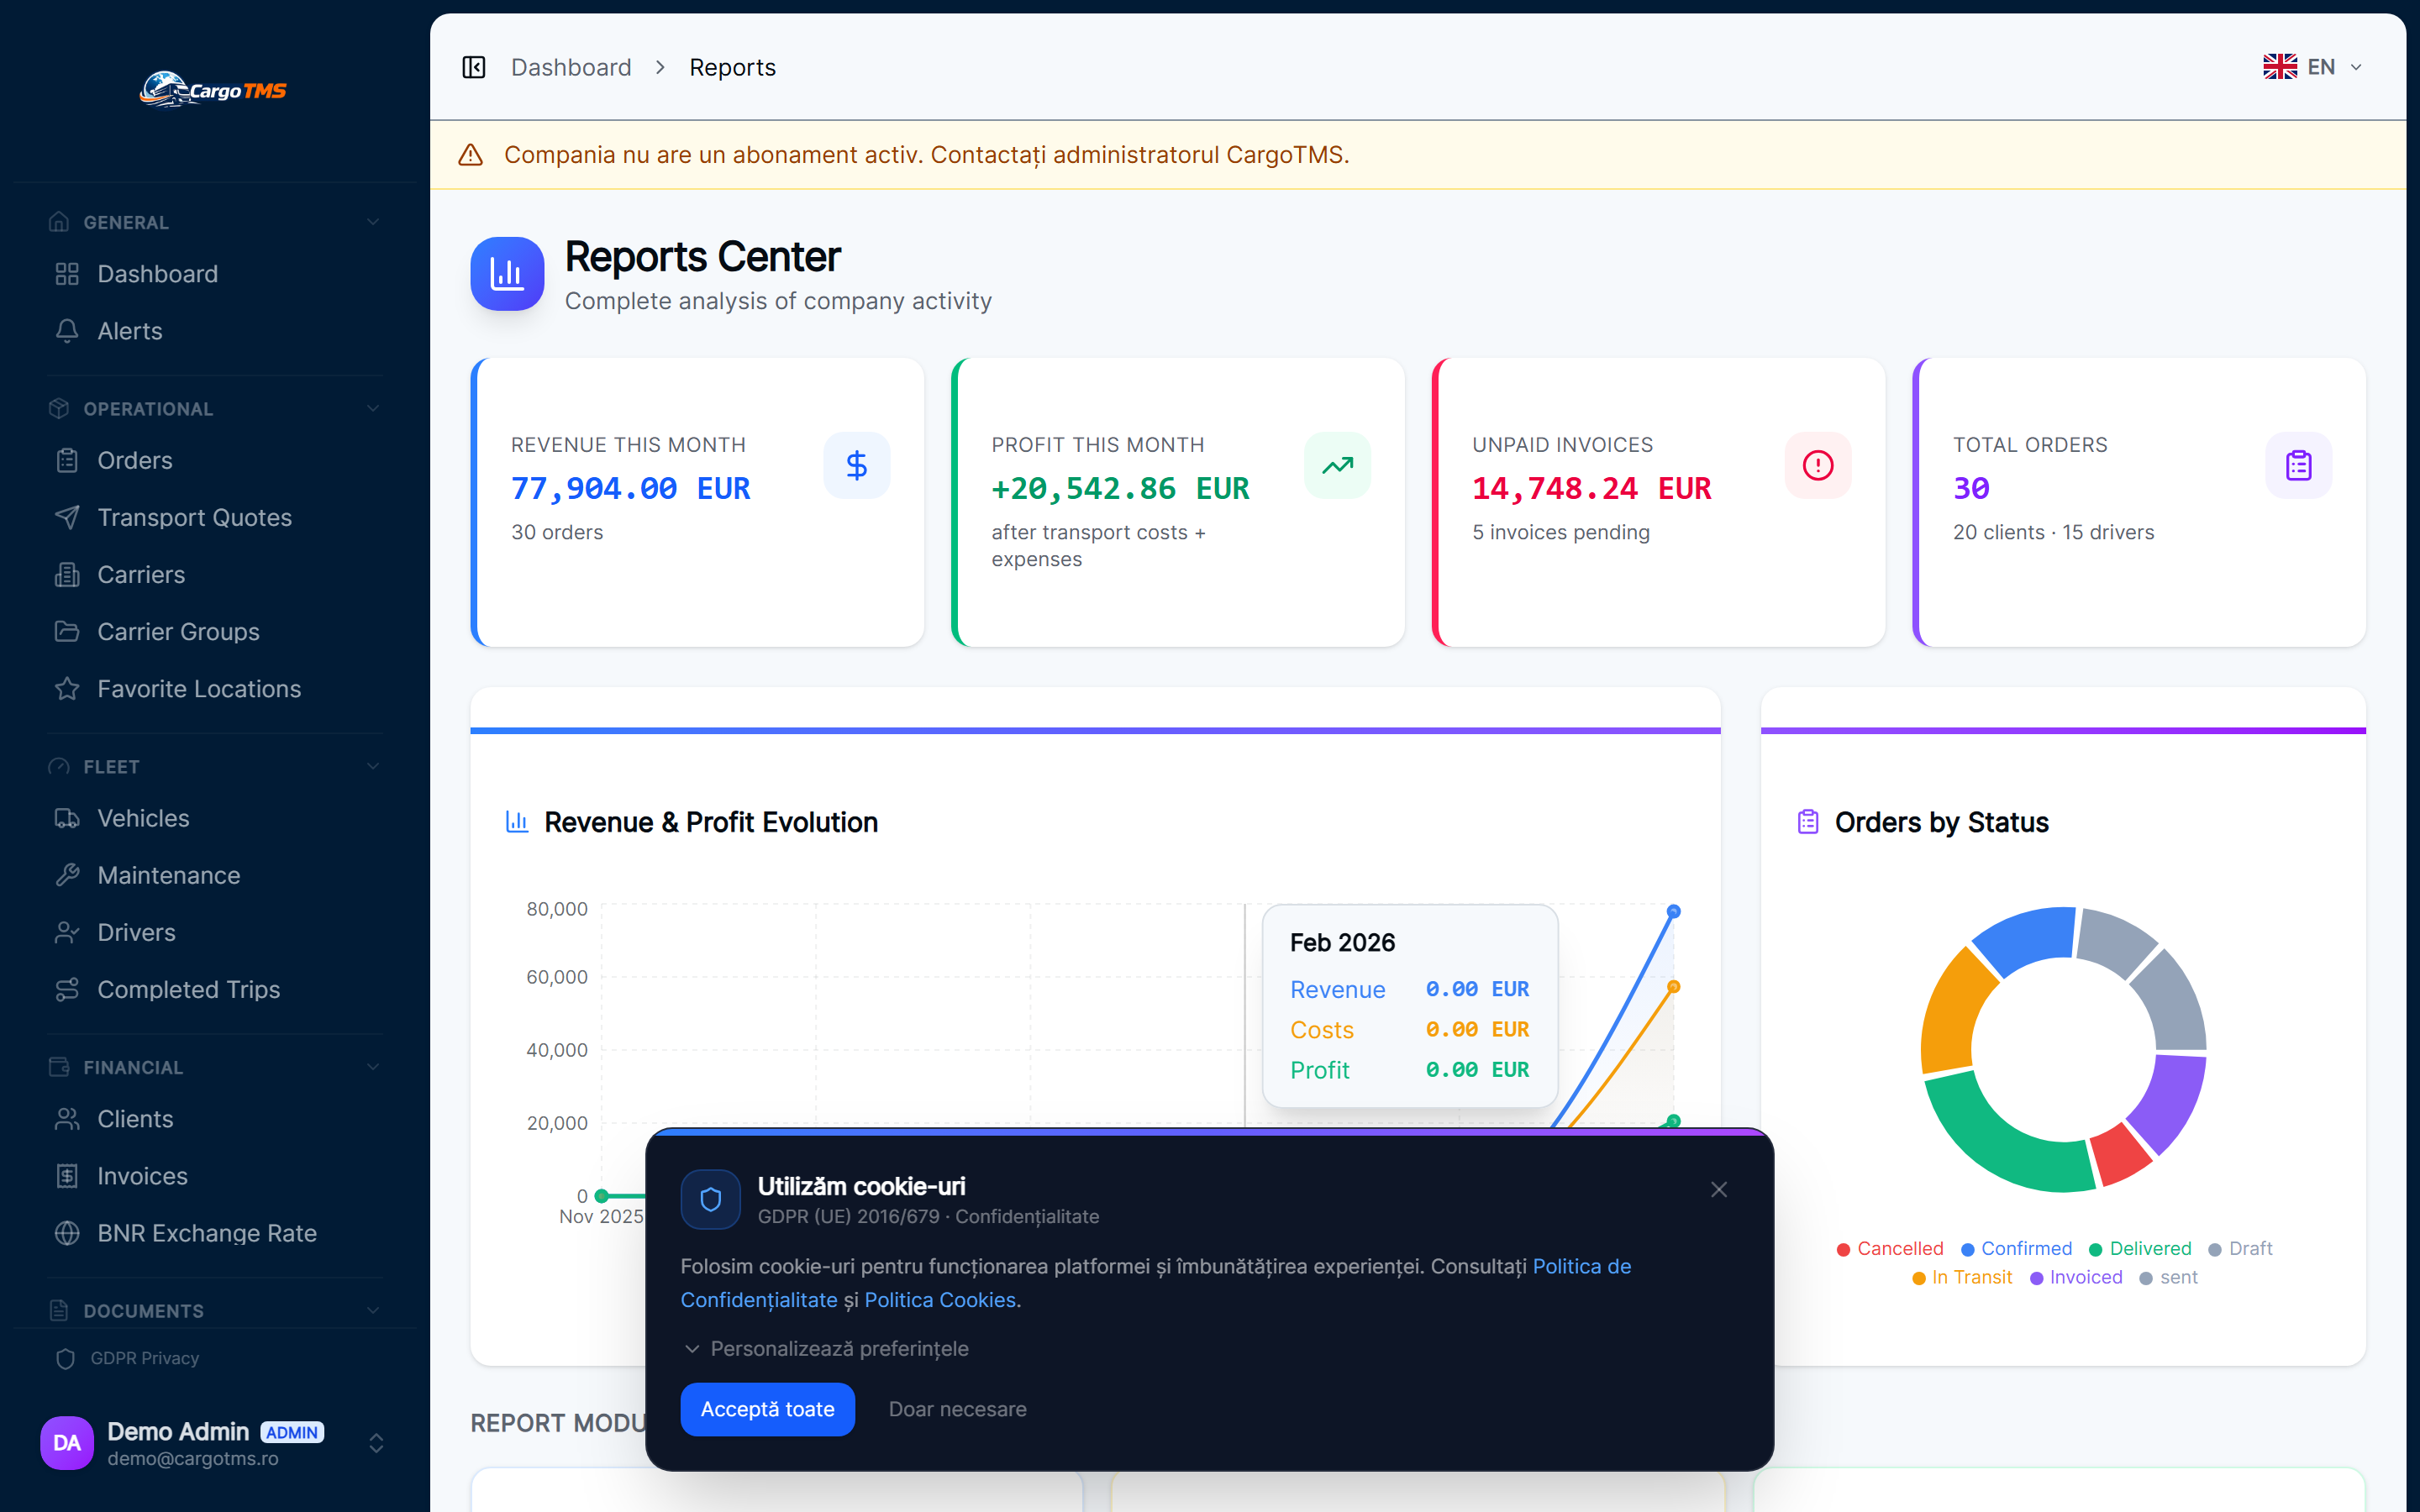
📊 Transport Intelligence

Built-in Transport Intelligence — Real-time KPIs Without Extra Tools

Revenue per month, profit per route, top clients, fleet costs, driver performance — all in one dashboard. No Excel exports. No BI tools. Just operational clarity.

Real-time
Revenue & profit
Per route
Profit analysis
Built-in
No extra tools
📊 Transport Intelligence

Built-in Transport Intelligence — Real-time KPIs Without Extra Tools

Revenue per month, profit per route, top clients, fleet costs, driver performance — all in one dashboard. No Excel exports. No BI tools. Just operational clarity.

Revenue & Profit Dashboard

Monthly revenue, total profit, margin per period — visible in real time. Chart showing revenue trend across 12 months without manual exports.

Profit per Route Analysis

Rank your routes by profit margin. See which lanes generate the most value and which are underperforming. Price decisions backed by data, not guesswork.

Top Clients & Revenue Concentration

See which clients generate the most revenue and which are unprofitable. Identify concentration risk and diversification opportunities in your client portfolio.

Fleet Cost Analysis

Total cost per vehicle: fuel, maintenance, insurance, tolls — over any period. Identify your most and least efficient vehicles in real time.

Driver Performance Reporting

Trips per driver, revenue per driver, expense ratios — over any time period. Support fair performance reviews with data, not memory.
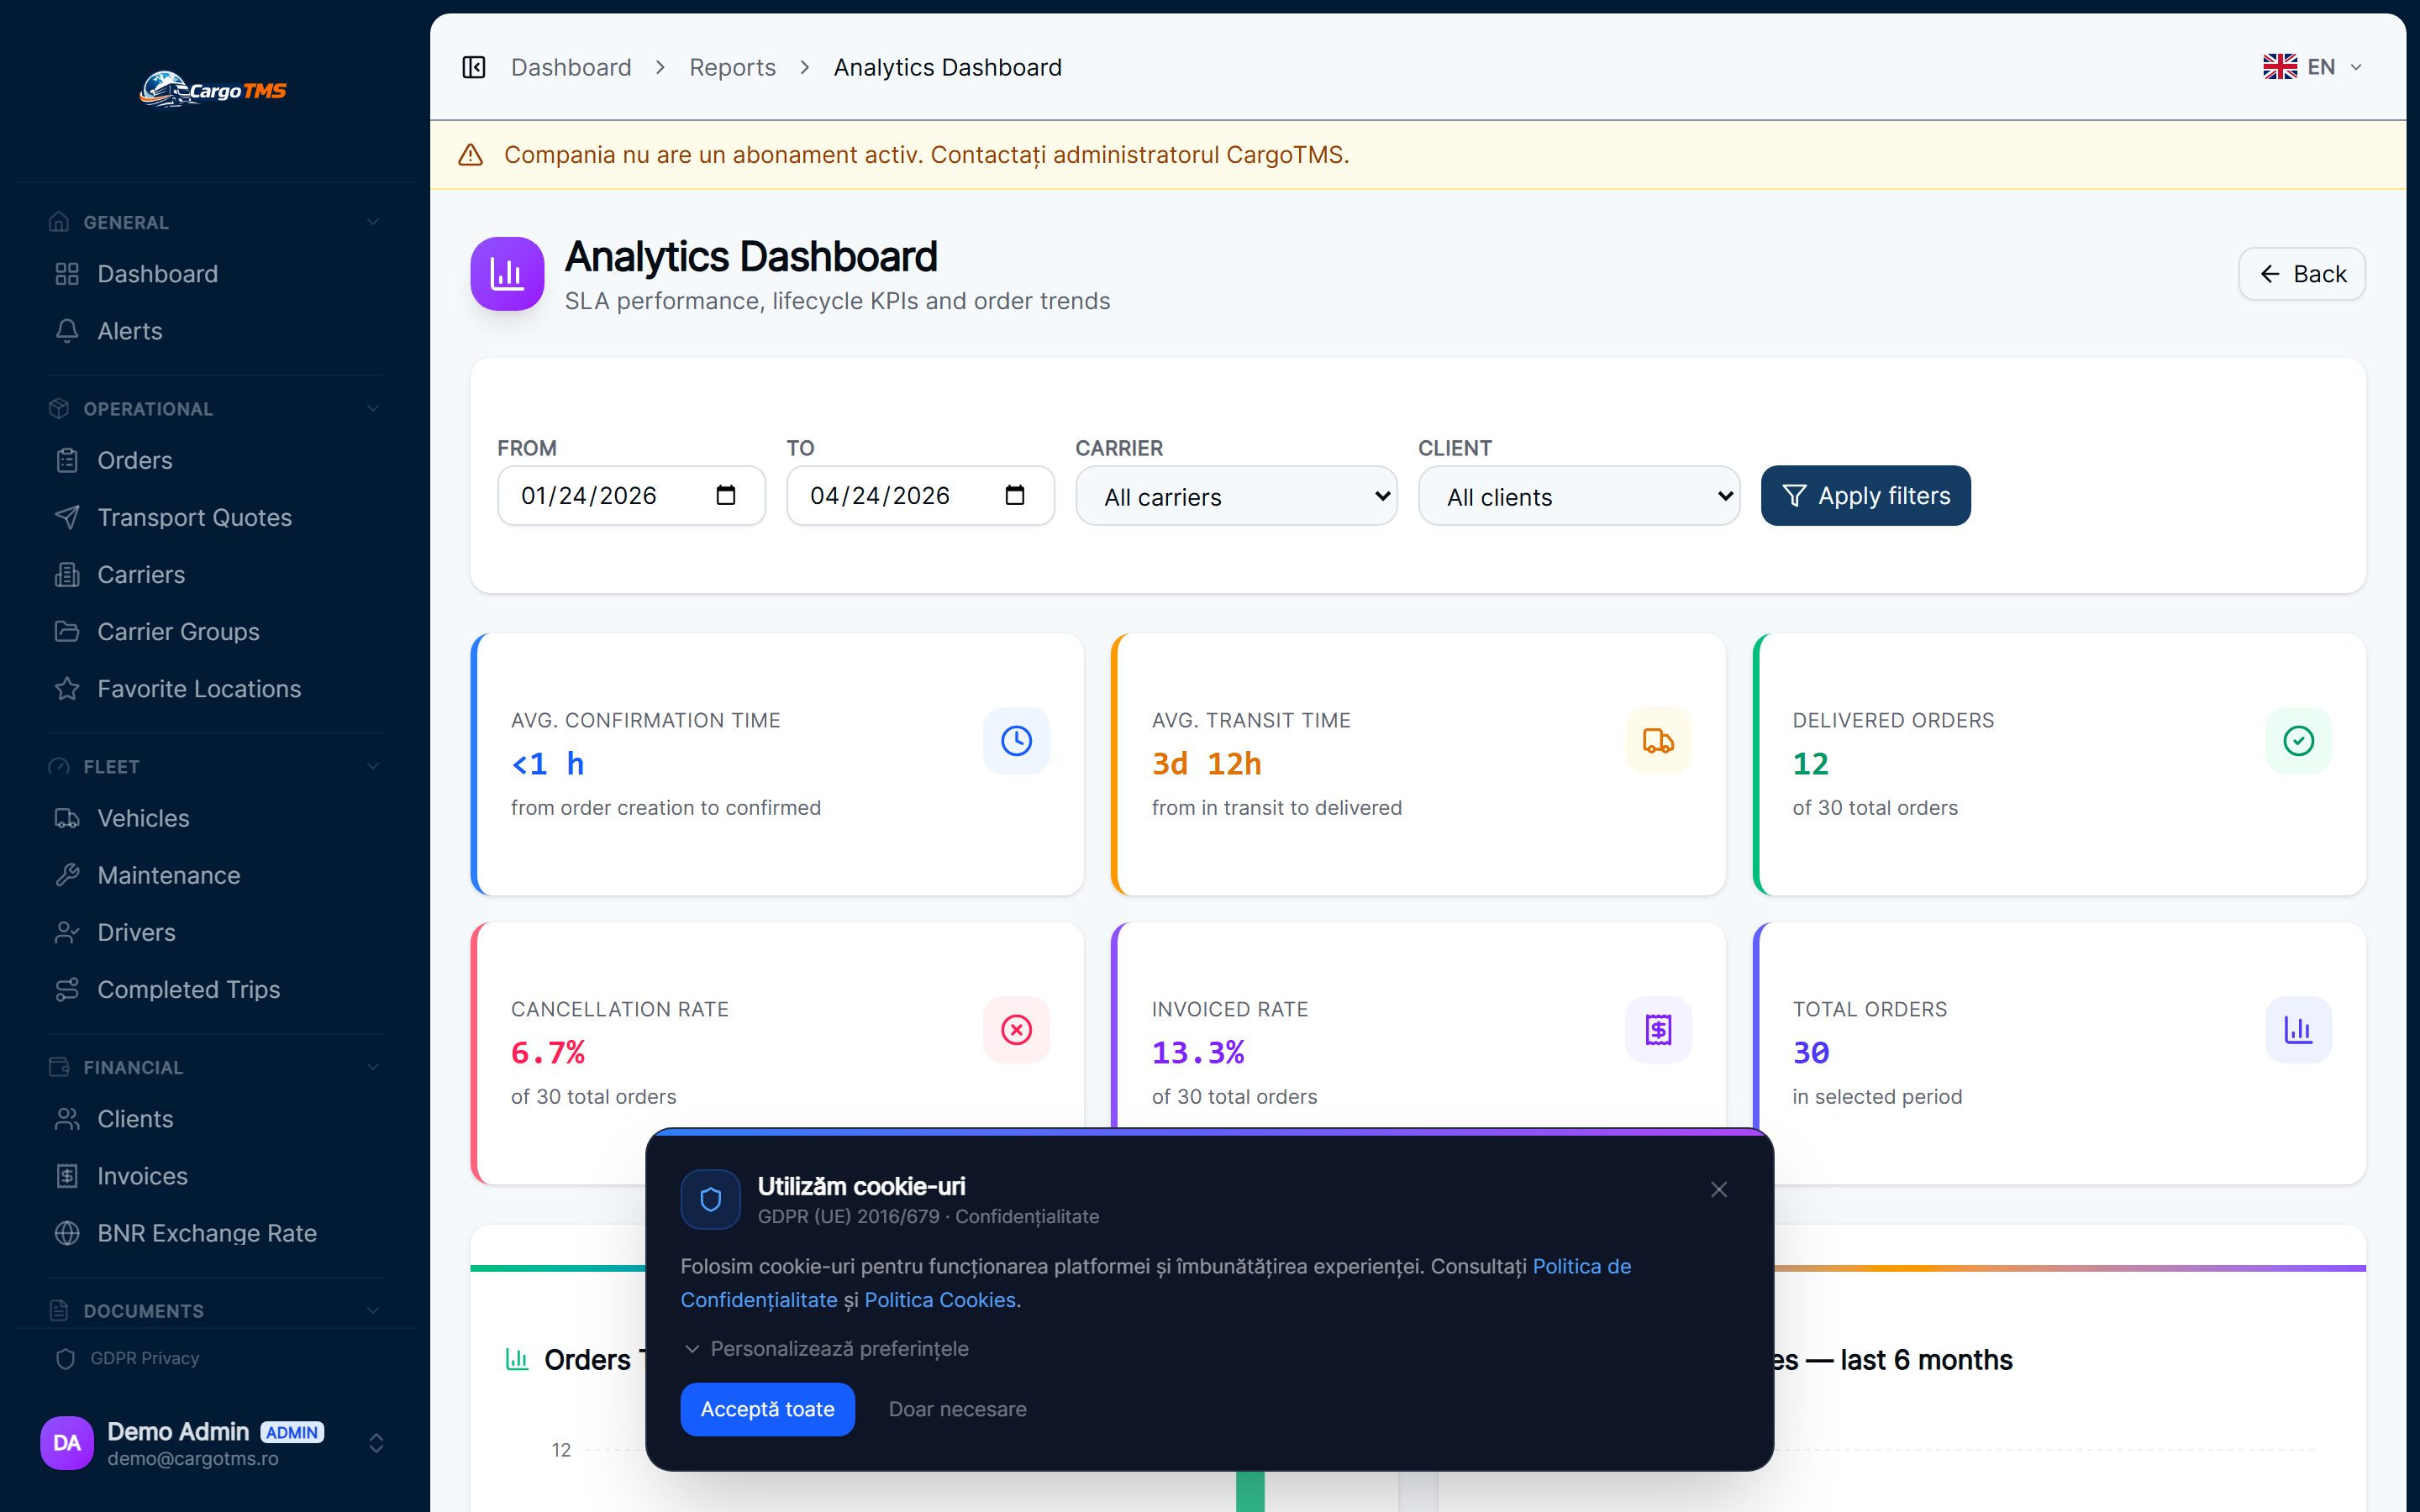
Order & Trip Analytics

Orders per period, completion rate, average delivery time, invoice cycle — operational KPIs that reveal where your workflow needs improvement.

How it works

Built-in Transport Intelligence — Real-time KPIs Without Extra Tools

01

Operational data collected automatically

Every order, trip, expense and invoice feeds into the analytics engine automatically. No manual data entry into separate reporting tools.

02

Dashboard shows live KPIs

The operations dashboard shows current month revenue, open orders, fleet status and alerts — updated in real time as operations happen.

03

Deep analysis on demand

Filter by date range, client, carrier, route, driver or vehicle to drill into any specific dimension. Find patterns that drive better decisions.

04

Export for external use

Export any report to Excel or PDF for external sharing, board presentations or accountant use.

Click to enlarge

Transport Intelligence

CargoTMS — Analytics dashboard showing revenue trend, profit per route and top clients
Transport intelligence — revenue, profit and operational KPIs in one real-time view
CargoTMS — Analytics dashboard showing revenue trend, profit per route and top clients — detaliu
📊 Transport Intelligence

Built-in Transport Intelligence — Real-time KPIs Without Extra Tools

Revenue per month, profit per route, top clients, fleet costs, driver performance — all in one dashboard. No Excel exports. No BI tools. Just operational clarity.

🚀 Request Free Demo
FAQ

Frequently Asked Questions

Is the analytics dashboard updated in real time?
Yes. All metrics reflect the current state of your operational data. As orders are completed, invoiced and paid, the analytics update automatically.
Can I export reports to Excel?
Yes. All reports support Excel export. You can also filter before exporting to only include the data range and dimensions you need.
How is profit per route calculated?
Route profit = client revenue minus carrier cost minus all trip expenses (fuel, tolls, driver expenses) attributed to orders on that route. The calculation is automatic based on logged operational data.
Can I analyse profitability for a specific period?
Yes. You can filter all analytics by date range — month, quarter, year or any custom period. Compare periods to identify trends and seasonal patterns.

See it in action

Request a free personalised demo. We'll walk you through the platform with your specific use case.

🚀 Request Free Demo 💳 View Pricing

No commitment · No card required · Response within 24h

Related Modules

💰 Invoice Visibility 📋 Order Management 🎯 Dispatch Management